Most of what IntervalCoach does is learn one athlete at a time: it watches how your overnight HRV, resting heart rate and sleep respond after your real sessions, and builds a recovery curve that is yours. But every one of those nights teaches the model something, and not just about you. Pooled across everyone, your data sharpens the defaults that every athlete starts from on day one, before they have any history of their own. That is a data flywheel: every user makes the model stronger, and that strength loops straight back to all of us.
This post is that loop made visible. Not a clever one-off finding, but the platform applied: the same engine that personalizes your training, turned around to look across thousands of curves at once, with the answers feeding straight back into how the product behaves for everyone. This is the first cut I want to share, because it changed how I think about a question every endurance athlete has an opinion on.
Do fitter athletes recover faster?
It feels obviously true. I believed it. The data says it is mostly wrong, and the way it is wrong is more useful than being right.
The recovery rate barely moves with fitness
We describe each recovery curve with a half-life: roughly how many days until you are halfway back from a session of that type. So I grouped athletes by fitness, using CTL (chronic training load, a solid proxy for how trained you are), and looked at the half-life for hard sessions in each band.
It is essentially a flat line. A racer at high fitness clears a hard session at about the same rate as someone less than half as fit. Pooled across the hard session types, the half-life sits around 1.1 days in every fitness band, with no meaningful trend up or down, which is already the opposite of what "fitter recovers faster" would predict. The same flatness held across sport types, all landing near 1.1 days, and across age groups.
If fitness does not buy you a faster bounce-back, why does training so clearly make you more durable?
What fitness actually buys: load tolerance, not speed
A recovery curve has two parts. How far a session knocks your overnight numbers down, and how fast they climb back. Training moves the first one, and leaves the second almost untouched.
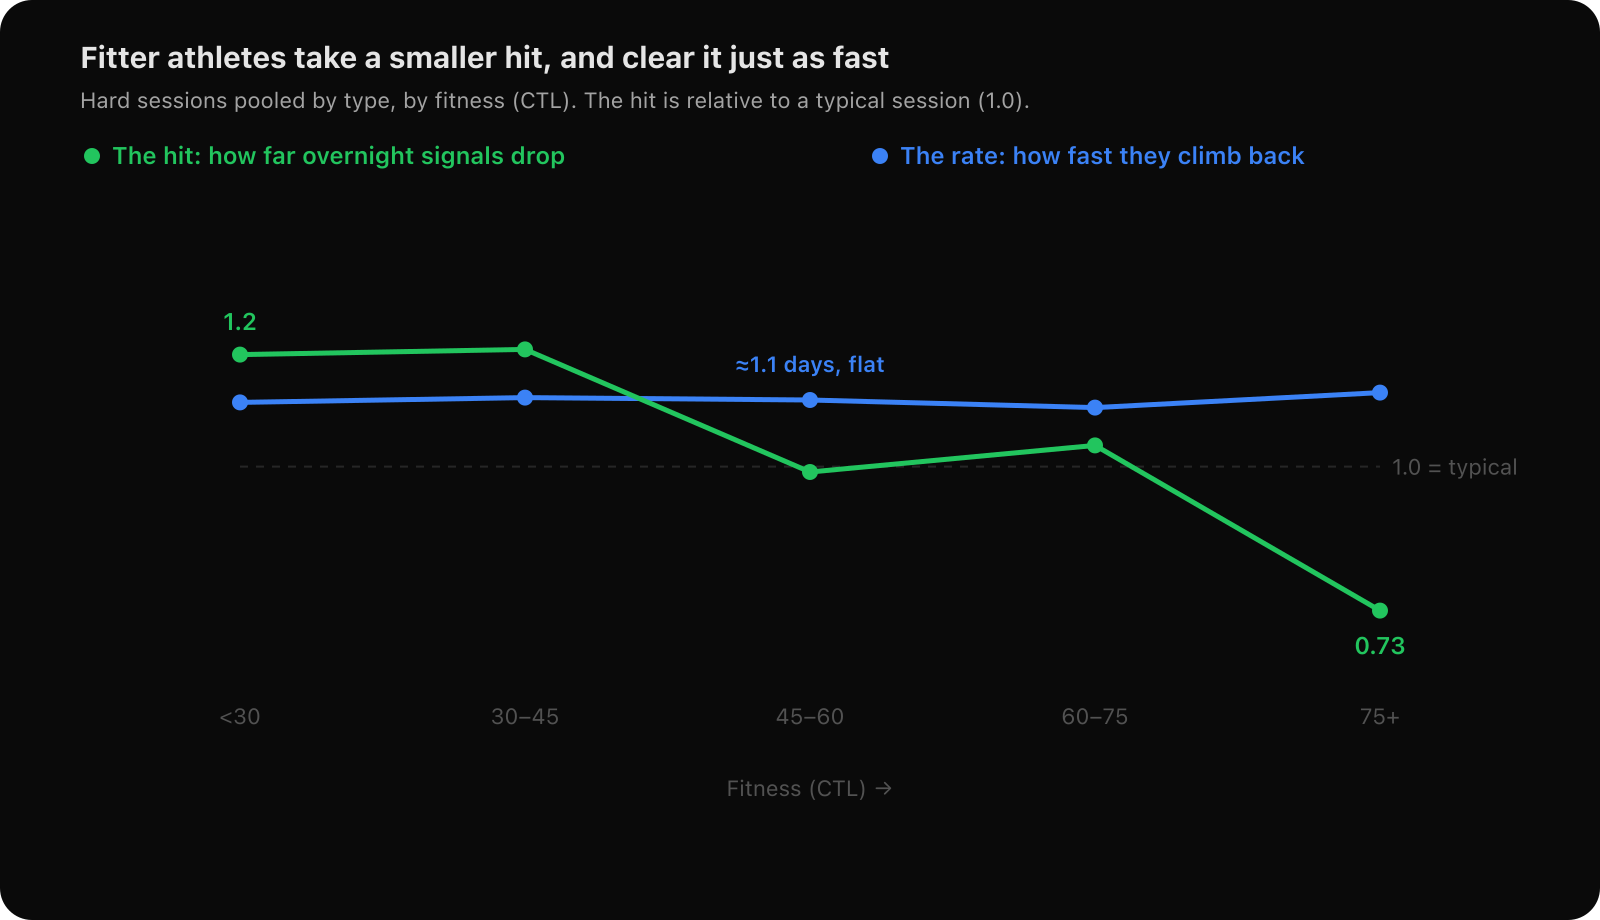
Pooled across the hard session types, the overnight hit in the fittest band runs about 40% smaller than in the least fit (roughly 0.73 versus 1.2 of a typical hit for that kind of session), while the half-life stays pinned near a day in every band. Each point pools threshold, tempo, VO2, anaerobic and long-ride curves, so it rests on a far broader base than any single session type would give, and the trend is clean: the least-fit bands sit clearly above a typical hit, the fittest clearly below, with the middle around the middle. Two caveats I want to be honest about: this compares different athletes at different fitness, not the same athlete getting fitter over time, and because we only measure the hit on sessions that left a clear overnight mark, the real gap could be larger than what survives that filter, not smaller. Either way, fitness is not making the session clear faster. It is making it cost less in the first place.
That distinction is not academic, and it is not just an observation we filed away. It is exactly how the model treats it, in the personal recovery curves we shipped recently: your fitness scales the magnitude of each session's hit, while the recovery rate stays anchored to what we measure for that session type. It is why a beginner's plan leaves more air around hard days and why that air closes as they get fitter, not because they suddenly recover quicker, but because the same work stops knocking them as far down.
That is what "fitter" really means in this data. Not quicker to recover, but harder to dent. The thing training actually builds is load tolerance: the capacity to take a hard session and barely feel it the next morning. The clock on the wall does not speed up; your resistance to the hit goes up.
Picture a Saturday group ride. Two riders take the same long pull off the front, the same hard hour, the same TSS on paper. The next morning their watches disagree. The fitter rider's HRV and resting heart rate barely moved overnight; the less-fit rider's dropped roughly 40% further. Neither one clears it faster, both are about a day from fully settled. But the fitter rider was knocked down less to start with, so she wakes up closer to baseline and ready to go again sooner. Same ride, smaller dent. That is the 40% in the chart above, and it is load tolerance you can feel in your legs the next morning.
The real lever on recovery time: the session, not the athlete
If who you are barely sets the clock, what does? Overwhelmingly, the kind of session you just did.
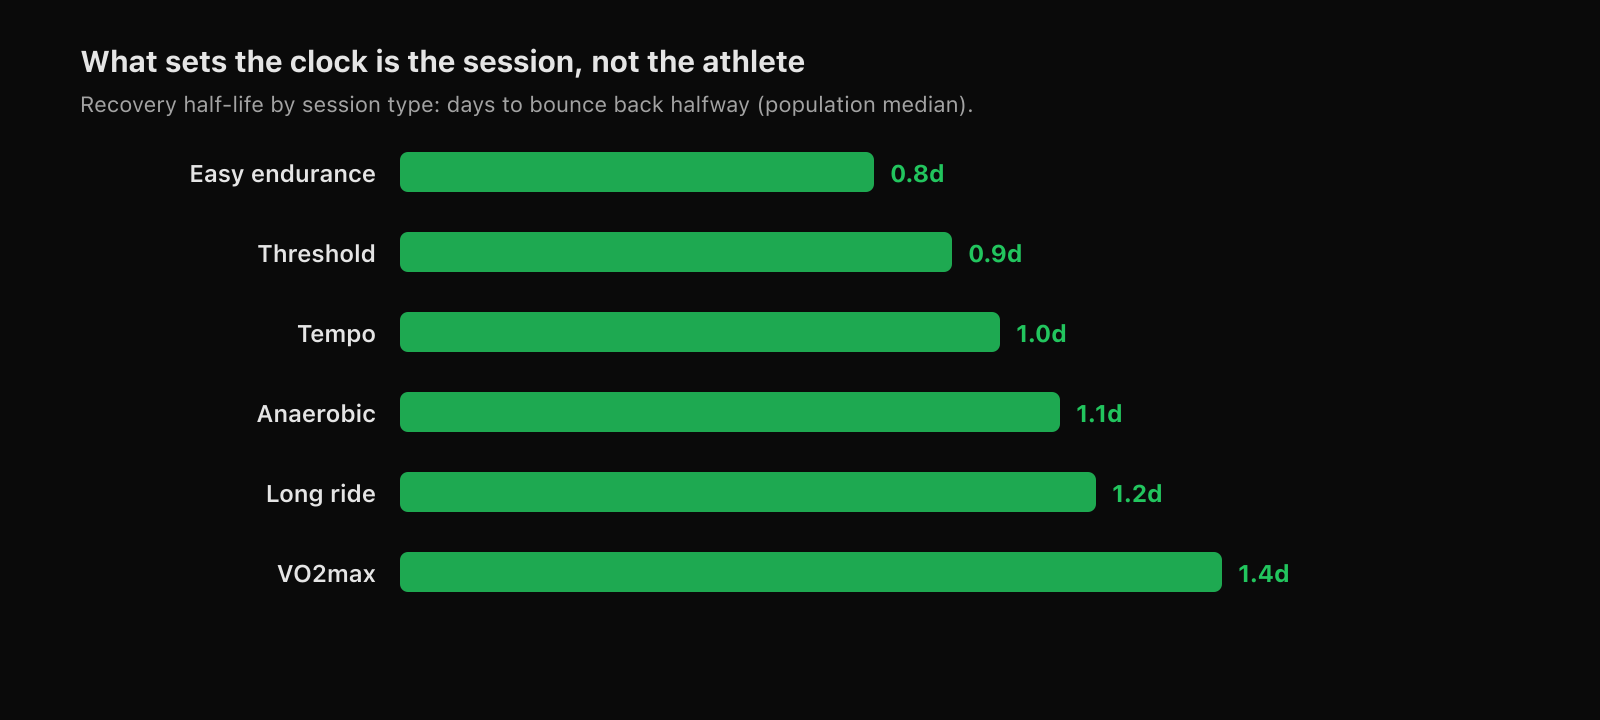
A five-hour ride and a set of VO2 intervals are not interchangeable the morning after, and a single "recovery: 64%" number off a watch cannot tell them apart. This is the whole reason IntervalCoach fits a separate curve per session type rather than collapsing everything into one score. The biggest lever on how long you need is not how fit or how old you are. It is what you just did to yourself.
How we measured this
A short note on method, because it is the part that makes this trustworthy.
Each curve is fit from an athlete's own history: we track how their overnight recovery signals drift in the days after each hard session of a given type, and fit an exponential decay. The half-life is that curve's time constant. A large share of our athletes have a recovery profile, but only a fraction produce a clean per-session-type fit (R²≥0.3), so we read only those. That keeps us on real recovery shapes rather than noise dressed up as a trend, but it also means each cut here rests on a sample of athletes rather than the whole population. To keep the fitness comparison honest we pool the hard session types per fitness band, so each point rests on a broader base than the handful any single session type would give on its own. One footnote: easy endurance rarely leaves a clear overnight mark, so its curve is the shakiest of the set, and its number is indicative rather than firm. Snapshot: June 2026.
The honest caveats
A few things I want to be straight about.
This is observational data from our own athletes, drawn from the curves that fit cleanly, not a controlled study. It is consistent enough across fitness, sport and age that we build on it, but it describes our population, not physiology in general.
We are also deliberately not making claims here about differences between men and women. We do not yet have enough recovery data from female athletes to say anything responsible, and we would rather stay quiet than overreach. The same goes for the menstrual cycle, which we are studying separately and will only write about when the data earns it.
The data flywheel
This is the part I find genuinely motivating. The model gets sharper every single day, because every athlete who trains and syncs adds to it. Your nights tune your own curve, and pooled with everyone else's they tune the defaults the next person starts from. More athletes means a sharper model, a sharper model means better coaching for everyone, and better coaching brings in the next athlete. Round and round.
It is the quiet advantage of training inside one system that learns, instead of stitching together tools that each forget. Findings like this one are simply that flywheel made visible: the population teaching us something we then hand back to every individual, automatically.
What it means for your training
If you take one thing from this: stop expecting fitness to buy you faster recovery. In our data it buys a smaller hit, not a quicker bounce-back, so use it to absorb more work rather than to turn sessions around sooner. The recovery clock is set mostly by the session, so plan the spacing around the type of work, not around how strong you feel in general. Go hard, give a VO2 day or a long ride the day-and-a-bit it actually wants, and let easy days be genuinely easy.
That is what your recovery curve does quietly every morning, and it is good to know the data behind it points the same way. This is the first of several reads we will share as the flywheel keeps turning.
— Martijn