This is the second read we are sharing from the same engine that learns your recovery. The first asked whether fitter athletes recover faster. This one asks a question every athlete has stood in the kitchen with, coffee in hand, on a morning they feel slightly off: is this just yesterday's session talking, or am I coming down with something? And can the overnight numbers tell the difference before I can?
So we looked. IntervalCoach reads your overnight wellness every night, and athletes mark sick days on their calendar. Line those sick days up at day zero, look back over the week before each one, and measure how every signal moved against that athlete's own baseline. Pooled across hundreds of real sick days, a pattern shows up.
Resting heart rate climbs, HRV sags
In the days before a sick day, your resting heart rate drifts up and your HRV drifts down, and the drift builds toward the night before.
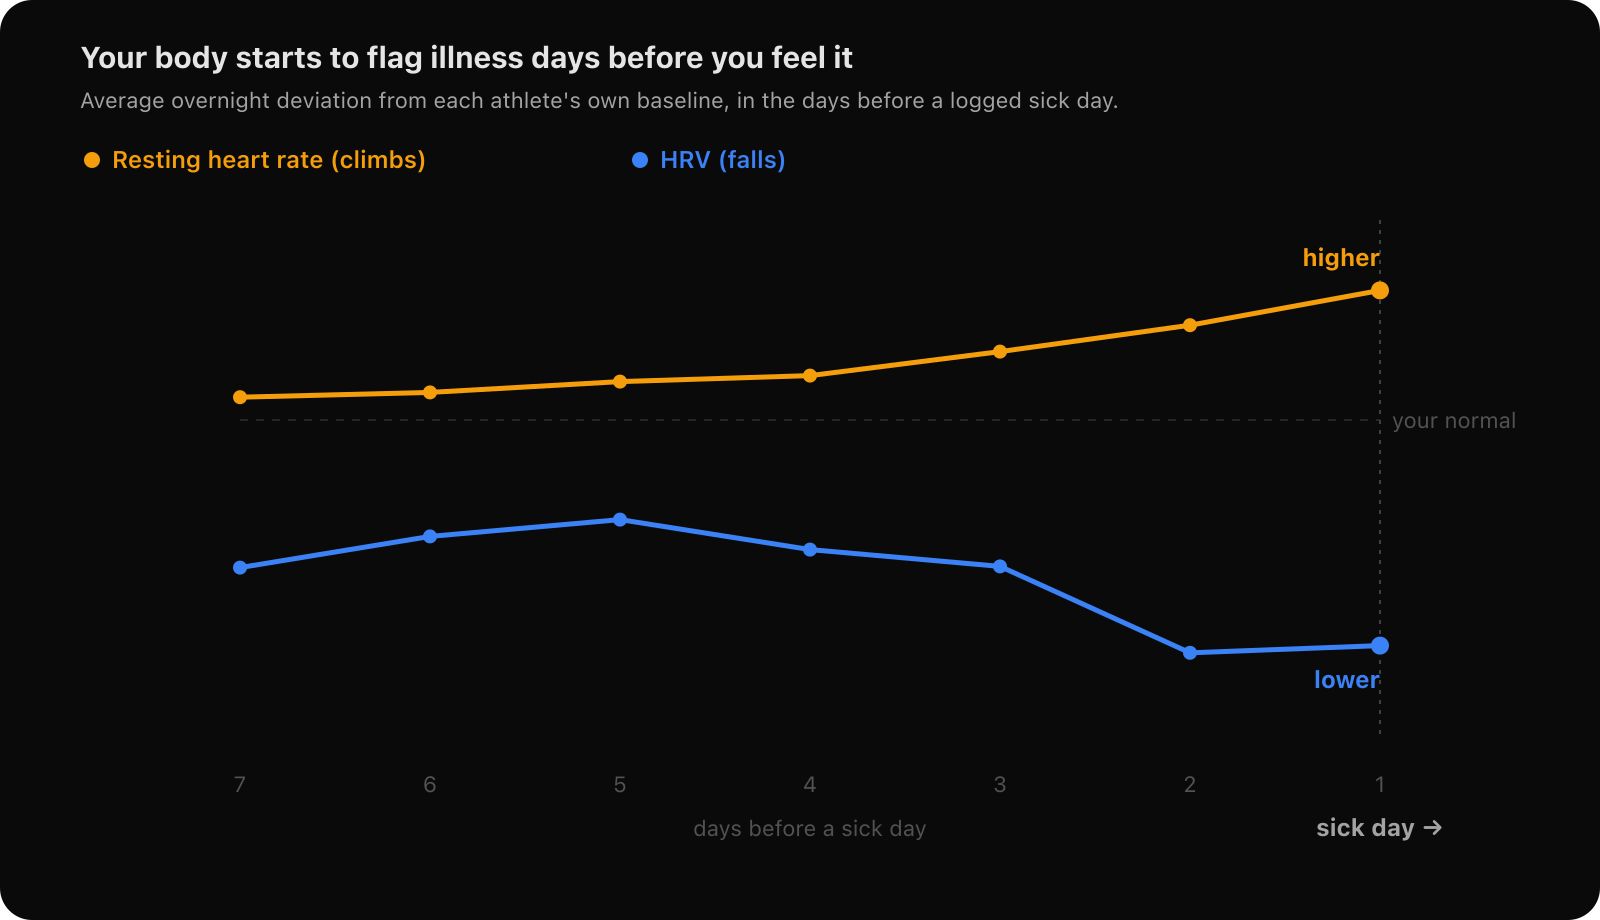
Resting heart rate is the clearest of the two. It rises steadily across the week and is at its highest the morning before illness lands. HRV moves the other way, lower than your normal, with its deepest dip in the last couple of days. Neither is dramatic on any single morning. These are averages across many sick days, including plenty that gave almost no warning, so the typical signal is a gentle nudge rather than a klaxon. That is the honest shape of it, and it is also the most useful thing to know: the signal lives in the multi-day drift, not in one alarming number. One high-resting-heart-rate morning is noise. Three mornings of it, climbing, with HRV sliding the other way, is your body telling you something.
How our data refined the textbook
That finding fed straight back into how IntervalCoach spots illness.
IntervalCoach already eases your training toward recovery when it thinks an infection is brewing. The way it decided that was, deliberately, to watch the illness-specific signals that do not move just because you trained hard: blood oxygen down, breathing rate up, skin temperature up. When two of those line up, it is an immune-event pattern, not a hard session. The reasoning was sound. Resting heart rate and HRV move with both training and illness, so on their own they cannot tell the two apart, and we kept them out on purpose.
That textbook starting point is the right one, and we are keeping it. What our own data adds is the signal that is there for almost every athlete: resting heart rate, which genuinely climbs before a sick day. Skin temperature and breathing rate are powerful markers too, but they depend on sensors not every wearable has, so building on resting heart rate means the early warning works for everyone, not only some.
So we sharpened the rule with what our athletes actually show. A sustained climb in resting heart rate over several days, together with an HRV drop, now corroborates an oncoming infection. It never triggers the response on its own, because it genuinely cannot separate illness from a hard block by itself, but it backs up a temperature, breathing or blood-oxygen reading, and stands in as the early warning when those sensors are not in the picture. Textbook defaults, sharpened by the data only we have.
Recovery outlasts the illness
The same data answered a second question, and this one surprised me more. We mark the day a sick spell ends. So how long does the body actually take to come back?
Longer than the calendar says, and later than you would expect.
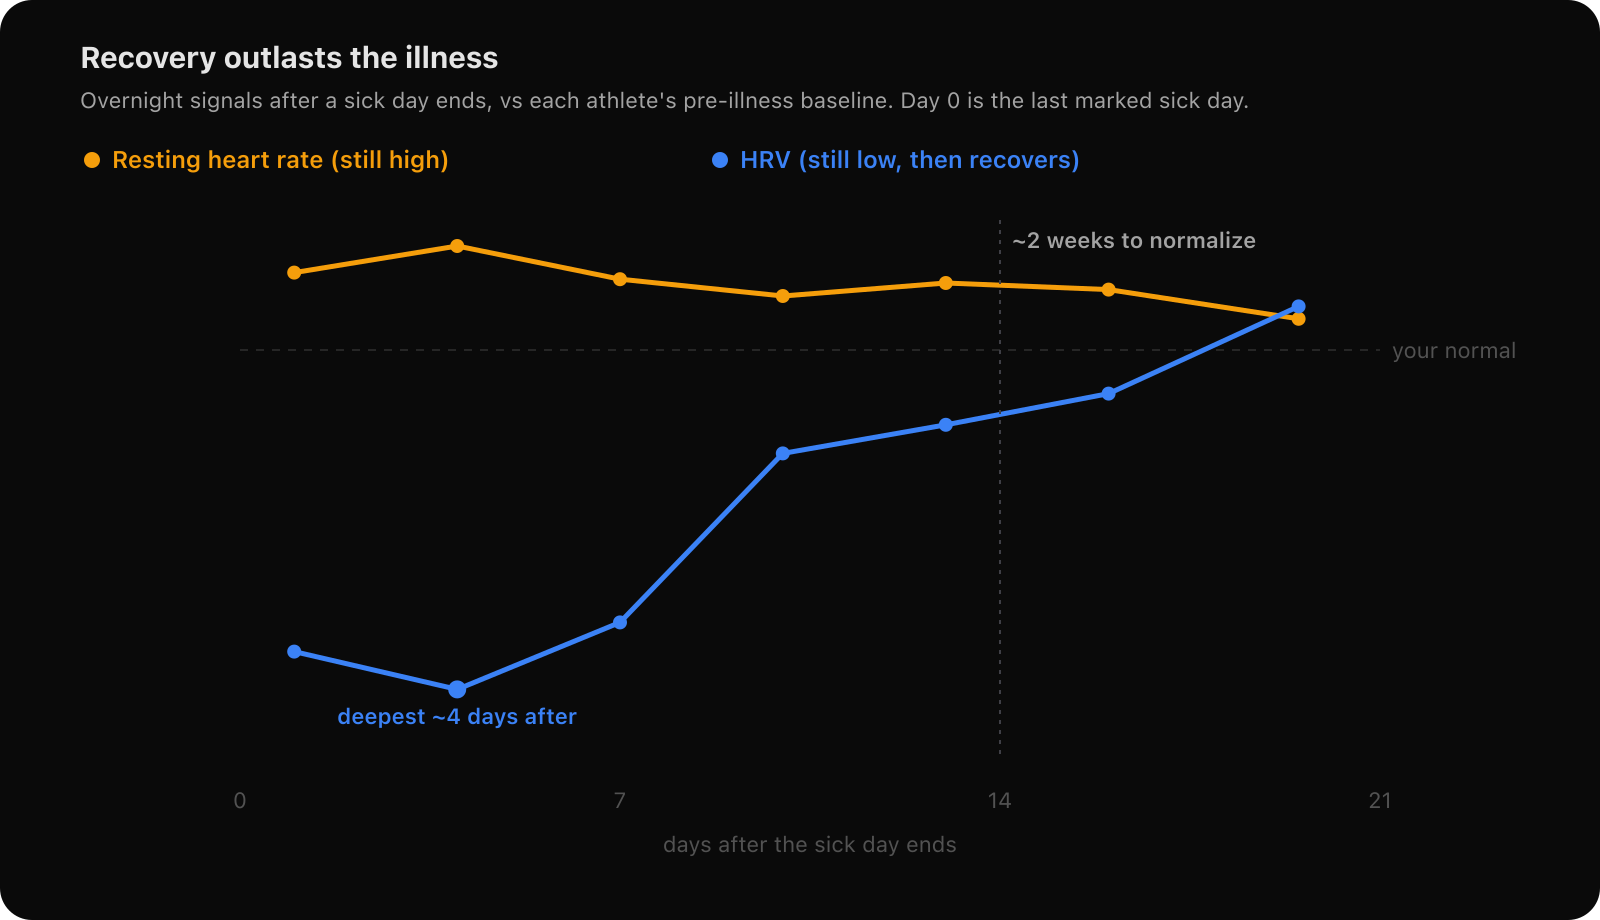
The disruption is at its worst around four days after the last marked sick day, not during it. Resting heart rate sits above your normal and HRV below it, and on average it takes the better part of two weeks for both to settle back. The day you feel well enough to call it over is not the day your body has finished the job.
The other surprise is what did not show up. The intuitive approach, and the textbook one, is to scale the comeback to how many days you were ill: a long flu should need longer than a one-day bug. But split the recovery by how long the illness lasted and that clean relationship is not there. If anything the briefest illnesses carried the longest tail in resting heart rate, most likely because a one-day marker often means someone pushed back into training before they were actually clear. How long you felt sick turns out to be a poor guide to how long you need.
What is a good guide is the signal itself. Your resting heart rate coming back to your own normal is a better all-clear than any countdown from the calendar. So that is how IntervalCoach now eases you back to training: less by how long the illness was, more by whether your body has actually come back.
Why we can keep getting better at this
This is the flywheel again, doing something concrete. Every sick day an athlete logs, and every night of overnight data, sharpens what the model knows about the run-up to illness, and that flows straight back into how cautious the coach is on a questionable morning.
And it keeps widening. As more athletes train with wearables that capture skin temperature and breathing, those signals fold into the same picture on top of the defaults we already start from, sharpening it further. It is useful today, and it gets sharper every week it runs.
What it means for your training
If you take one thing from this: treat a multi-day creep in your resting heart rate as a real signal, not noise. One elevated morning after a hard day or a late night means little. But when your resting heart rate has been climbing above your own normal for a few days and your HRV is sagging at the same time, especially if your throat feels scratchy or your head is foggy, that is the moment to take the easy week before your body forces a worse one on you. Training hard through the start of an infection is the reliable way to turn three easy days into two lost weeks.
That is what IntervalCoach now watches for on your behalf, and it is good to know the data behind it points the same way. More reads as the flywheel keeps turning.
— Martijn