Two questions decide most of my training days. In the morning: am I recovered enough to do the hard session, or should I back off? And the moment I do back off: how long until I am actually ready to go hard again?
For years the honest answer from most tools was an average. "Leave 48 hours between hard sessions." A single recovery percentage off your watch. Useful as a rule of thumb, but it does not know that you bounce back from a VO2 session differently than from a five-hour ride, and it does not know that you recover differently than the person next to you. Worse, it rarely shows its reasoning, so when the number disagrees with how you feel you have nothing to go on.
Over the last weeks we shipped the pieces that replace that with something personal and transparent. They are easy to read as separate features, but they are not. They are one system that learns how your body responds, remembers it, and uses that memory to answer both questions every morning, out loud.
The loop, in one picture
Three parts, working together:
- Your signals go in. Every night your wearable records HRV, resting heart rate and sleep, and on many devices breathing rate, skin temperature and blood oxygen too. Every morning you can add how you actually feel. That is the raw material.
- Your recovery curve is the memory. IntervalCoach watches how those signals respond after your real sessions and learns, per session type, how fast you come back. That is the part that is genuinely yours.
- Your readiness score is today's answer. It reads the curve and this morning's signals and lands on a single number, with the reasoning shown.
Each part feeds the next, and the output feeds back in tomorrow. Let me walk through them.
Your recovery curve: the memory
Recovery is not one number. A long endurance ride leaves a different mark than a set of VO2 intervals, and it clears on a different timeline. So IntervalCoach fits a separate curve for each kind of session: endurance, tempo, threshold, VO2, long endurance and anaerobic.
Each curve is described by a half-life: roughly how many days until you are halfway recovered from that kind of session. It is learned from your own history, by watching how your recovery signals drift in the days after each hard effort and how quickly they settle back: HRV, resting heart rate, sleep and deep sleep, plus breathing rate, skin temperature and blood oxygen when your wearable records them, and the soreness and fatigue you log in the morning check-in. HRV, resting heart rate and sleep carry the most weight; the rest sharpen the picture when they are available. It starts from proven population defaults so it is useful immediately, and it personalizes as your data accumulates, so over time the curve stops being the average and starts being you.
That memory is not just a chart. It sets how your hard days are spaced, it powers the "you will be recovered from this session in about N days" line on each activity, and it feeds the readiness score below.
Because every athlete's curve teaches the model, those same curves let us look across the whole population. We did exactly that, and the first read surprised me: do fitter athletes recover faster?
Your readiness score: today's answer, and what moves it
Every morning IntervalCoach distills all of it into one 0-100 readiness score with a green, amber or red band. The point was never to hide the reasoning behind a number; it was to make the reasoning glanceable and then let you open it up.
Here is exactly what goes into it. It starts from your readiness level, the day's verdict, which already weighs your form, sleep, recovery and any sign of illness. Then three signals nudge that starting point:
- HRV and resting heart rate, balanced against your own baselines. Fresher than usual lifts the score; a rough night pulls it down.
- Where you sit on your recovery curve, given your recent hard sessions. Ahead of what your curve predicts is a bonus; still inside the window is a penalty.
- Your training variety over the past week, because grinding the same load every day is its own kind of risk.
Tap the ring and it shows its work: the starting point, then each plus and minus, adding up to your score. And the ring's colour follows your physiology, so on a morning when your body disagrees with the calendar, it tells you honestly rather than forcing a cheerful green.
A worked example
Say you did a hard threshold session two days ago and then slept badly. Your plan had a quality day queued, so your readiness level starts at 78, Ready. But the ring lands on amber, 64, and tapping it shows why:
- Starting point, Ready: 78
- HRV and resting heart rate: −8 (HRV down, resting heart rate up this morning)
- Recovery curve: −6 (your threshold half-life is about two days; you are not fully absorbed yet)
- Result: 64, amber
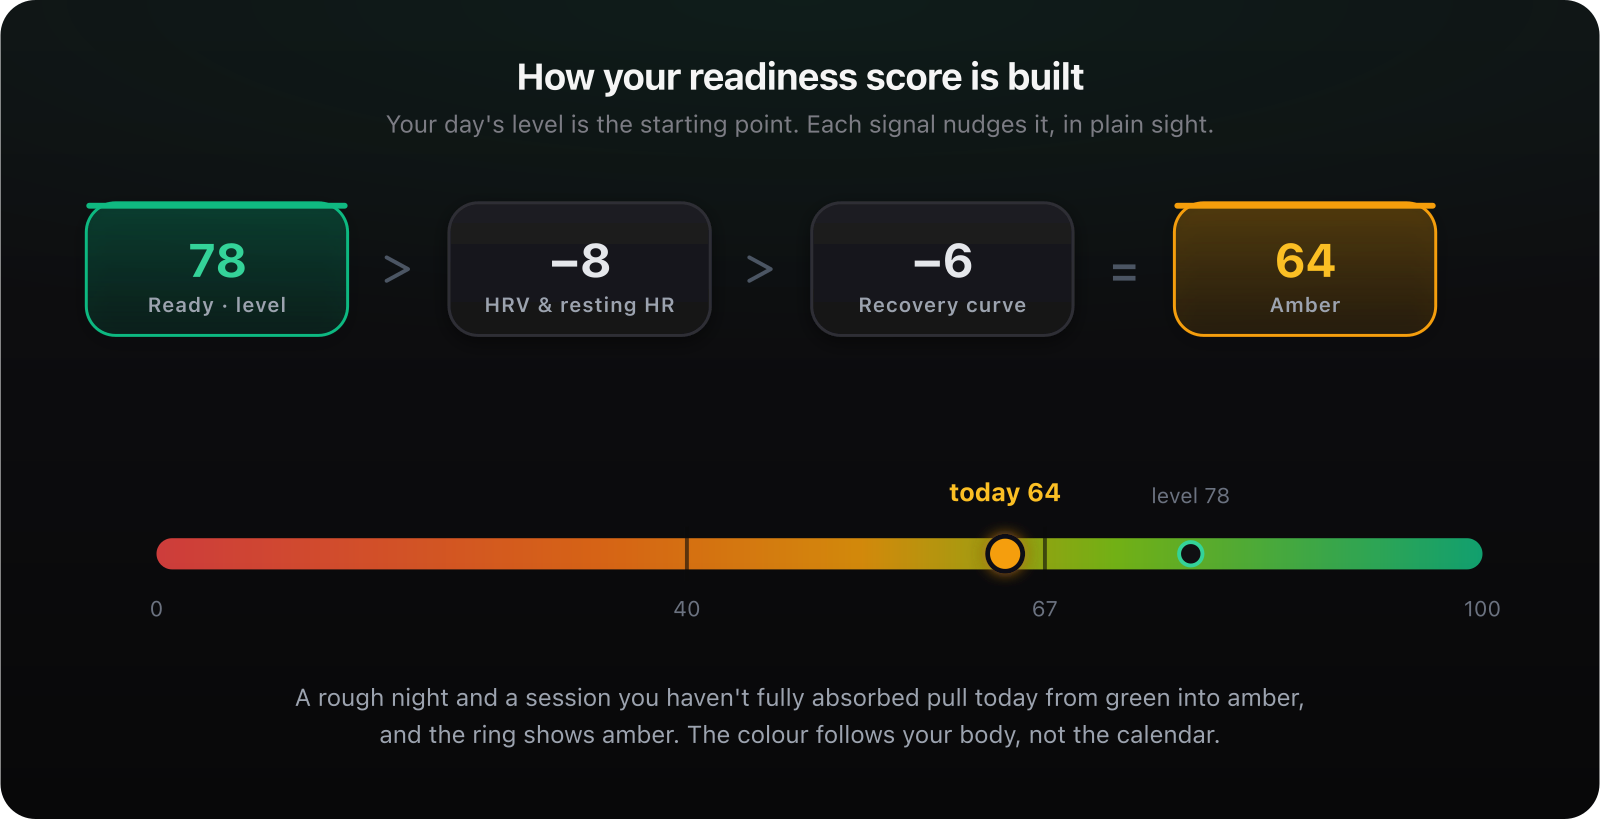
The calendar said go. Your body said not quite. The ring shows amber, and if you ask Coach+ it will say the same thing in words: hold the hard effort about a day, your curve has you ready by Thursday. Same data, one coherent answer, with the math in plain sight. (Numbers here are illustrative; yours come from your own baselines and curve.)
Your own feel is part of it
The wearable does not see everything. A stressful week, dead legs, a niggle starting up; you feel those before any sensor does. So the morning check-in lets you log sleep, soreness, fatigue, stress, motivation, mood, injury and hydration on the same scale Intervals.icu uses, and that subjective read feeds the same loop alongside the overnight data. A day that feels off is accounted for, not just a day that measures off.
The same idea you have already seen
If this sounds familiar, it should. Earlier this week we shipped illness detection: reading the overnight signals that training cannot fake to tell "getting sick" apart from "trained hard," and easing the day toward recovery when something is brewing. That is the same principle as readiness, on a different question. Readiness is the daily verdict, the recovery curve is the memory behind it, and illness detection is the system protecting that memory by leaving sick days out of what the curve learns. They are not three features. They are one system reading your body and adapting, then telling you why.
Where it shows up
The score and the curve follow you across everything: the readiness ring on the dashboard and on a home or lock-screen widget, the "vs your curve" meter and the recovery read-out in your Daily Briefing, the recovery-from-this-session line on each activity and in your post-workout email, the recovery snapshot in your weekly summary, and Coach+, which can now answer "why can't I go hard yet?" straight from your own curve. Pro and Max add the full per-stimulus chart on Analytics; the score and the curve themselves are for everyone.
The whole thing comes down to a simple promise: learn how you recover, use it to answer the questions that actually decide your day, and never make you take the answer on faith. The more of your context IntervalCoach can see, the better those answers get, and the less you have to guess on the mornings that matter.
— Martijn