There is no shortage of AI-powered training tools right now. Most of them are a language model with a prompt that says "generate a cycling workout." IntervalCoach is not that. Every decision the system makes, from how it structures your week to when it tells you to rest, is grounded in published research. I want to walk through what is actually in the engine and why.
Five periodization models, each backed by research
IntervalCoach does not have one generic approach to structuring training. It implements five distinct periodization models, each with its own mesocycle structure, intensity distribution targets, and weekly patterns:
- Linear Periodization (Bompa & Haff, 2009) is the classic progressive overload approach: 3-5% weekly TSS increases followed by a recovery week. It works well for beginners and athletes returning from a break who need predictable structure.
- Undulating Periodization (Rhea et al., 2002) uses wave loading with varying weekly emphasis. One week focuses on aerobic volume, the next on threshold, then VO2max, then recovery. The constant variation prevents adaptation plateaus.
- Block Periodization (Issurin, 2010) concentrates training stress into focused 3-week blocks targeting specific energy systems. It produces significant adaptation in short timeframes but demands strong recovery capacity. This model also drives the transition logic between training phases, with recovery microcycles between blocks to allow supercompensation.
- Polarized Training (Seiler, 2010) enforces 80% easy and 20% hard with virtually no moderate intensity. This distribution mirrors what researchers found when studying elite endurance athletes. The system actively validates that your intensity distribution stays on target.
- Pyramidal Training (Esteve-Lanao et al., 2007) targets 75% easy, 15% moderate, and 10% hard. Unlike polarized, it embraces tempo and sweet spot work as a productive training stimulus. It is a good fit for athletes who respond well to sustained efforts.
You can pick your own model based on preference, or let the system recommend one. The recommendation considers your training history, time until your goal event, and personal preferences. A beginner 20 weeks out from a race gets linear periodization. An experienced athlete with 6 weeks to go might get block periodization to maximize adaptation in a short window.
Exponential tapering from Mujika & Padilla (2003)
When you are approaching a goal event, IntervalCoach applies an exponential taper model based on the Mujika & Padilla (2003) meta-analysis. Their key findings: optimal volume reduction is 41-60%, intensity should be maintained (not reduced), exponential tapers outperform linear or step tapers, and the optimal duration is 8-14 days.
The system implements this as an exponential decay function with three profiles. The aggressive profile hits 40% of normal volume at race day, matching the research-optimal range. Standard lands at 55%. Conservative holds at 75% for athletes who get anxious about losing fitness. In all cases, the volume floor is 20% to avoid zero-training days, and intensity sessions are preserved throughout the taper.
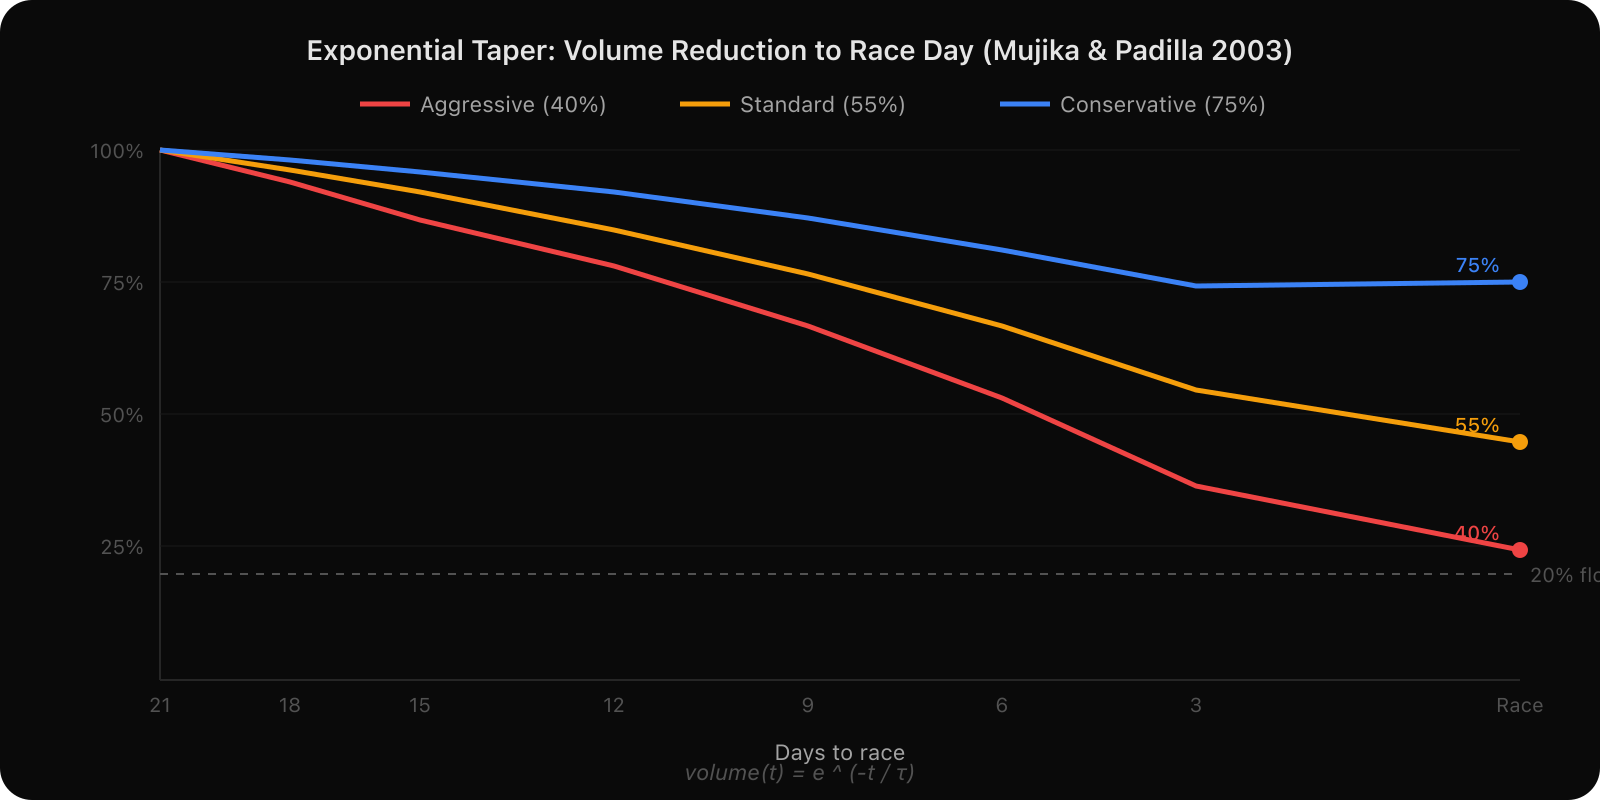
This is not a hand-wavy "do less before your race" approach. It is a mathematical curve: volume(t) = e^(-t/τ), where τ is calculated from the taper profile and total taper length.
Injury prevention: ACWR and training monotony
Two research-backed metrics run continuously in the background to catch injury risk before it becomes a problem.
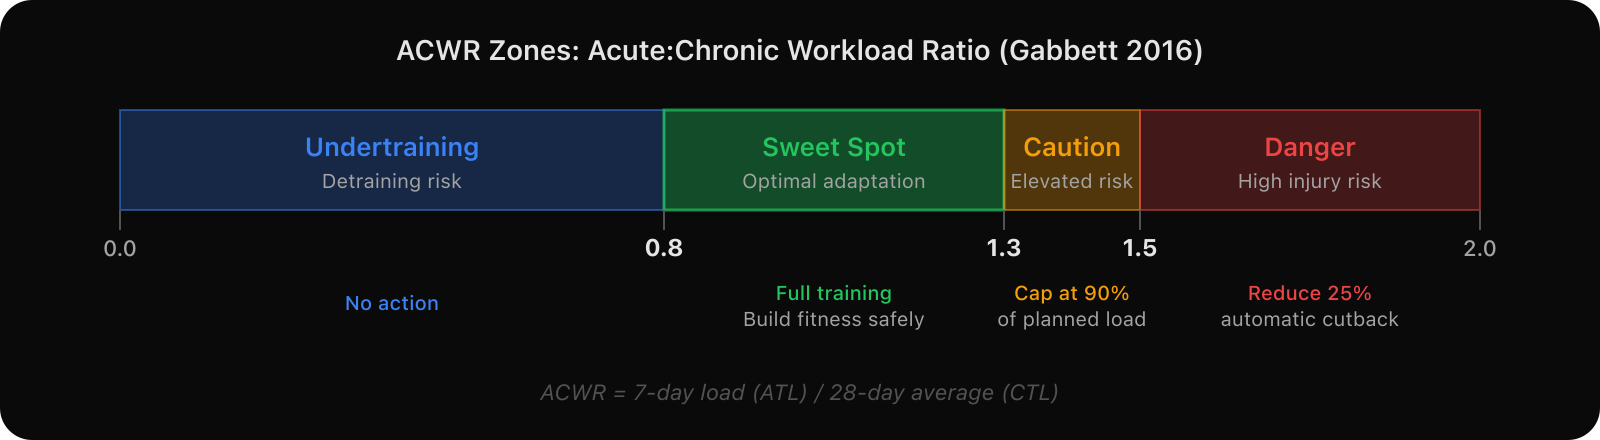
ACWR (Acute:Chronic Workload Ratio) comes from Gabbett (2016), who found it to be one of the best predictors of injury risk from training load changes. IntervalCoach computes this as your 7-day load (ATL) divided by your 28-day average (CTL). When the ratio exceeds 1.5, the system triggers automatic load reduction of 25%. Between 1.3 and 1.5, it caps your load increase at 90% of planned. The sweet spot is 0.8-1.3, where you are building fitness without spiking injury risk.
Training Monotony is based on Foster (1998). It measures daily load variation: mean daily load divided by its standard deviation. When monotony exceeds 2.5, you are doing the same load every day, which is a known risk factor for overuse injuries. The system flags this and recommends varying your daily training stimulus. Importantly, it accounts for context: high monotony during a taper or recovery week, where uniformly low loads are intentional, is not flagged as a problem.
Readiness assessment: layered recovery signals
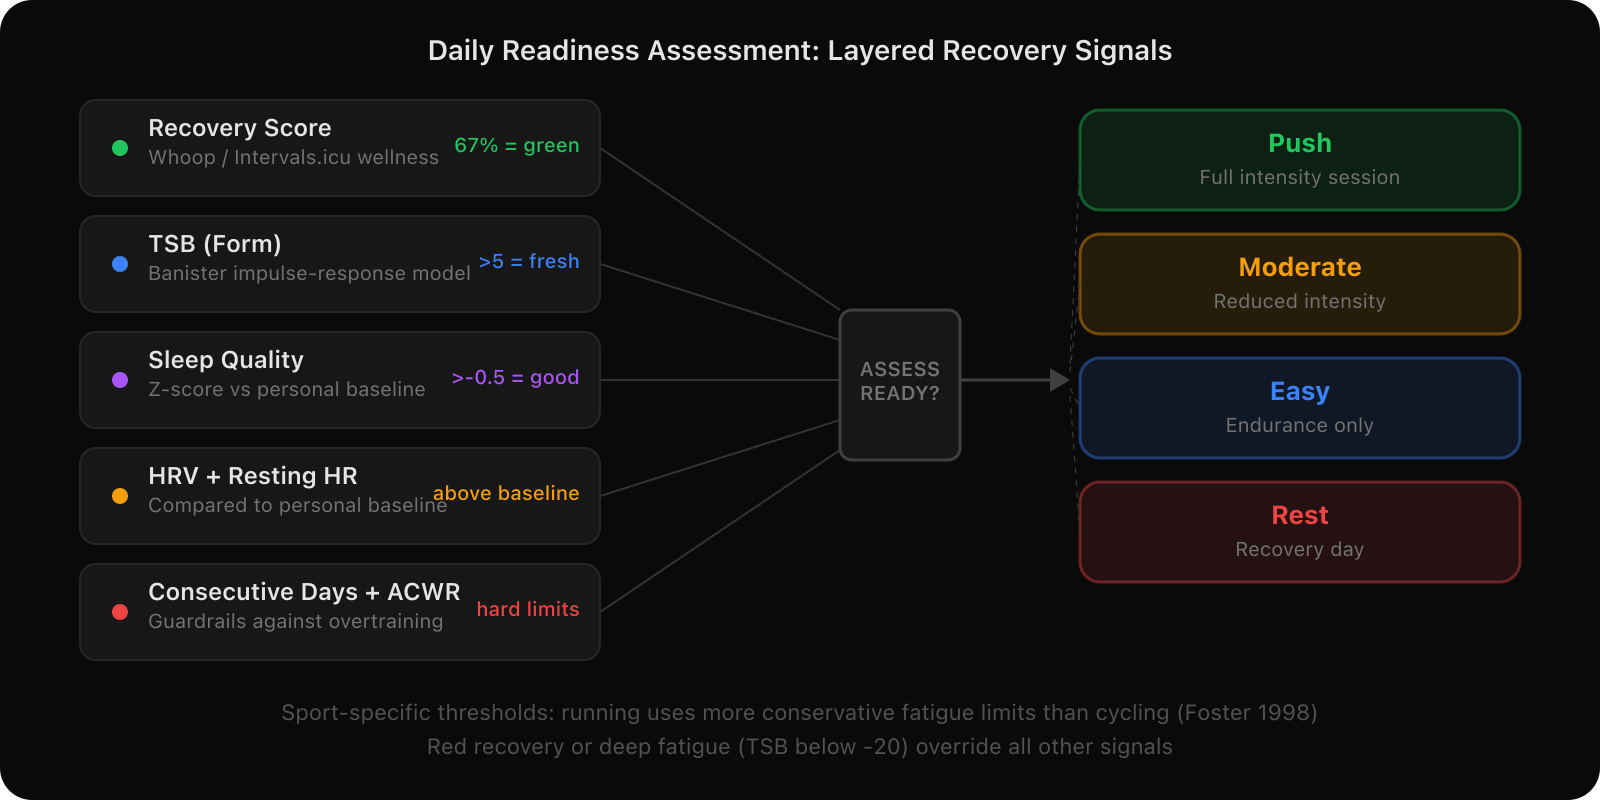
Every day, before the system decides what workout to give you, it runs a readiness assessment. This is not a single number. It layers multiple signals with different weights:
- Recovery score (from Whoop or Intervals.icu wellness data) using a green/yellow/red classification. Red recovery means rest, period.
- TSB (Training Stress Balance) using the Banister (1991) impulse-response model. The system distinguishes between fresh (TSB > 5), optimal (-10 to 5), tired (-20 to -10), and fatigued (below -20).
- Sleep quality assessed against your personal baseline using z-scores, not just absolute hours. If you normally sleep 7 hours and got 5, that matters more than someone who always gets 5.5 and got 5.
- Physiological signals like HRV and resting heart rate, again compared to personal baselines. If your sleep was poor but your HRV is above baseline and resting HR is below baseline, the system trusts those physiological signals over the sleep number.
- Consecutive training days and days since last rest, which act as guardrails against overtraining regardless of what the other metrics say.
The assessment also uses sport-specific thresholds informed by Foster (1998): running produces higher perceived exertion at the same training load as cycling, so the fatigue thresholds are more conservative for runners.
Intensity distribution tracking
IntervalCoach tracks your Training Intensity Distribution (TID) in real time and compares it against your periodization model's targets. If you are on polarized training and your data shows 15% of your time in Zone 3, the system will flag that you have too much moderate intensity and suggest going easier or harder.
This is computed from actual zone time data (power zones when available, heart rate zones as fallback), not just from workout descriptions. An interval workout with a low overall intensity factor but significant time above threshold gets correctly classified as a high-intensity session.
The zone boundaries themselves follow Coggan (2003) for cycling power zones and Daniels (2014) for running pace zones. Each zone is defined as a percentage of FTP or critical speed, with sport-specific ranges.
Phase transitions with hysteresis
Training phases (Base, Build, Peak, Taper, Race Week) are not just calendar dates. The system uses readiness indicators to verify that you are actually ready for the next phase. It checks CTL stability, fatigue levels, and recovery status before advancing you.
To prevent phase oscillation (bouncing between Build and Base when your CTL is right on the boundary), the system implements hysteresis: minimum durations in each phase, CTL stability requirements for exit, and sport-specific TSB thresholds that must be cleared. Session RPE, based on Foster (1998), acts as an additional override. If your reported effort consistently exceeds what the model expects, the system holds you in the current phase until recovery catches up.
The Banister model underneath it all
The foundation of everything is the Banister (1991) impulse-response model. CTL (Chronic Training Load) decays over 42 days. ATL (Acute Training Load) decays over 7 days. TSB is the difference. This model is used for fitness tracking, form estimation, taper targeting, and projecting where your fitness will be on race day.
For runners, ATL uses a modified decay constant (Foster, 1998) to account for the higher physiological cost of running at equivalent training loads. The system also applies sport-specific fatigue thresholds: cycling can handle a TSB of -30 where running would flag that as deep fatigue at -20.
Why this matters
Some of this is visible in the UI: the dashboard shows your CTL, ATL, and TSB. Analytics tracks your ACWR, training monotony, and intensity distribution. The training plan page shows your current phase and periodization model. But most of the decision-making happens behind the scenes. The periodization model structures your week. The taper curve sharpens you for race day. The ACWR and monotony checks keep you healthy. The readiness assessment decides if today is the right day to push.
I built IntervalCoach because I wanted a training tool that makes decisions the way a well-read coach would. Not by guessing, but by applying what the research actually says. That is what separates this from throwing your data at a chatbot and hoping for the best.